In this part, we will focus on network traffic. More often than not, thick client applications have some sort of network connectivity. They talk to some server(s) to do things.
Previous parts are:
Discovering the Endpoints
In part 1 we did some network discovering with Procmon. Now we will do more using both Wireshark and Procmon. IRL use whatever tool you are comfortable with.
We do this because we need to figure out where the application talks to and using what protocol. At your day job, this step is probably the best bang for your buck in terms of the number of vulnerabilities found. Thick client applications are notorious for having inadequate server-side controls and trusting the client too much.
Capturing Loopback Traffic on Windows with Wireshark
Since we have deployed our FTP and MSSQL servers locally, we need to be able to capture local traffic. Windows does not have a real loopback adapter so WinPcap driver (used by Wireshark) cannot do it. The fix is using the npcap driver instead. For more information read https://wiki.wireshark.org/CaptureSetup/Loopback.
Download and install npcap from https://github.com/nmap/npcap/releases and then install Wireshark.
Recon with Wireshark
Run Wireshark, choose Npcap Loopback Adapter, and the VM's LAN. Then start capturing traffic.
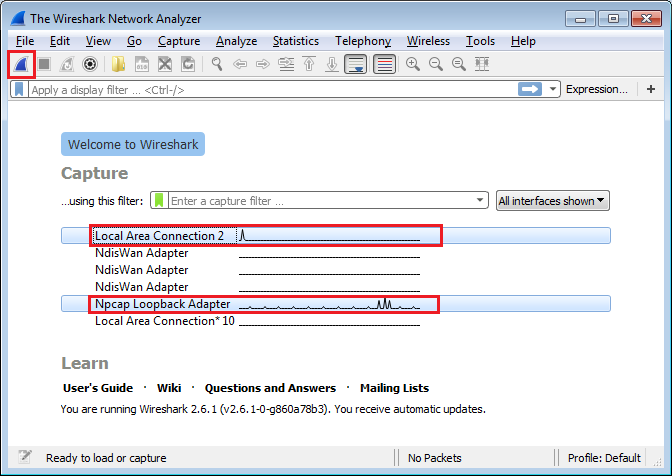 Setting up Wireshark to capture traffic
Run the patched application from the previous post but don't do anything.
Fetch Login Token
Click on the Fetch Login Token button. We already know where it goes, but let's inspect it with Wireshark.
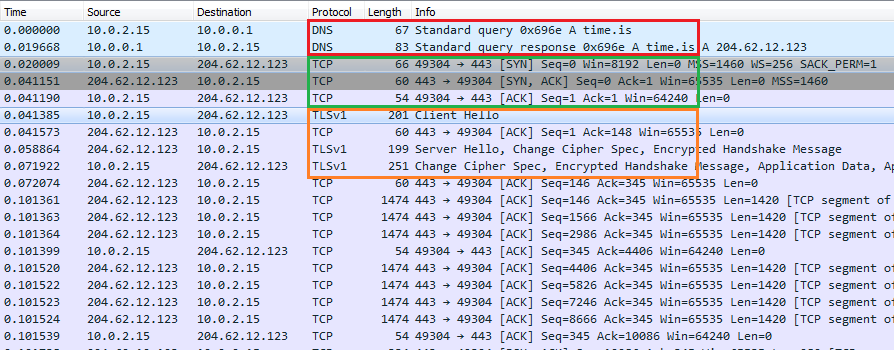 Captured traffic to time.is in Wireshark
Looking at the capture, it's clear what the application is doing.
- Red: DNS lookup for
time.is - Green: TCP connection to
time.is(204.62.12.123). We can see the handshakeSYN-SYNACK-ACK. - Orange: TLS handshake with
time.is.ClientHello,ServerHello, and the rest.
Normal User Login
Clear the capture and this time login with a valid set of non-admin credentials (e.g. rebecca:rebecca).
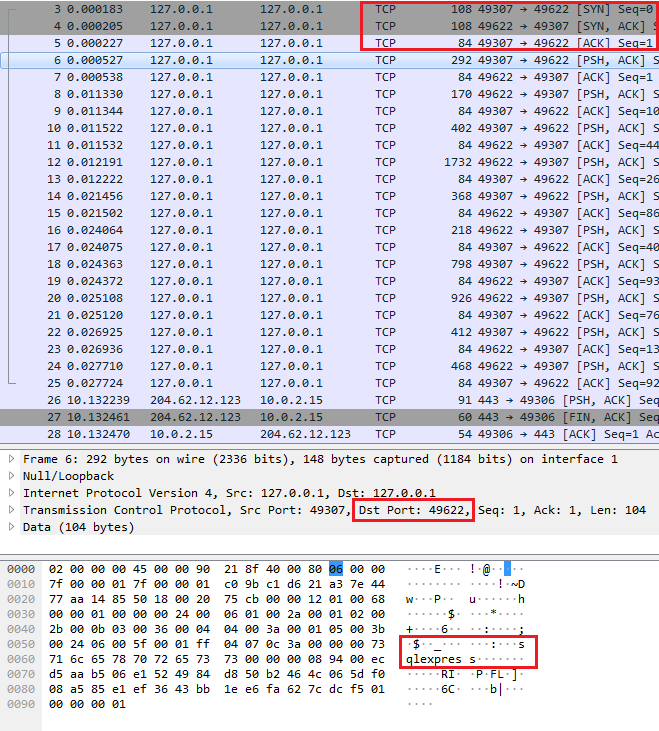 MSSQL traffic captured in Wireshark
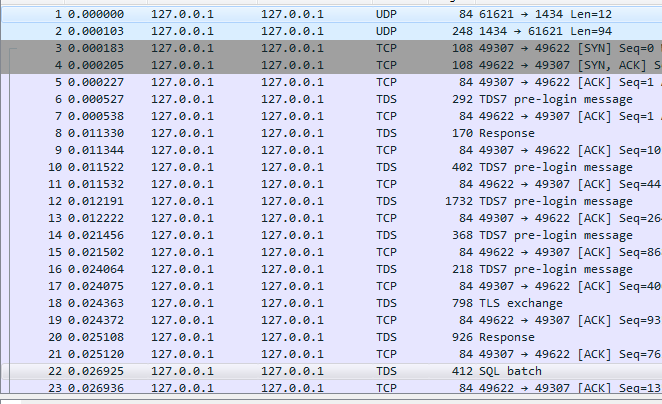
First, we see the TCP connection and then the login traffic to port 49622. To decode the traffic with Wireshark, right-click on any outgoing packet and select Decode As.... Then select TDS for the combo box under Current. This tells Wireshark to decode all traffic to that port using the TDS dissector.
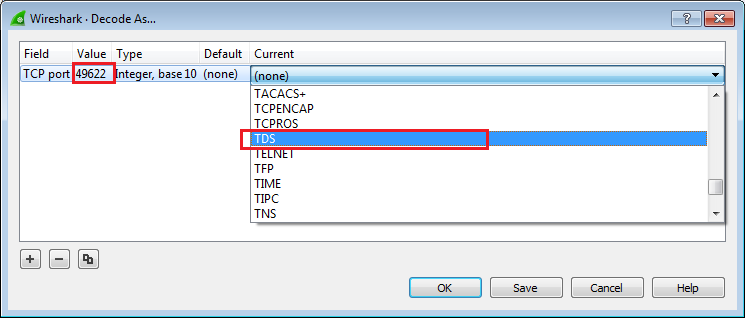 Choosing the TDS dissector for MSSQL traffic
And now packets are annotated.
 Annotated MSSQL traffic in Wireshark
Some observations:
- TLS is not enabled. That's bad.
- SQL queries are created on the client and sent outside. This is ripe for exploitation.
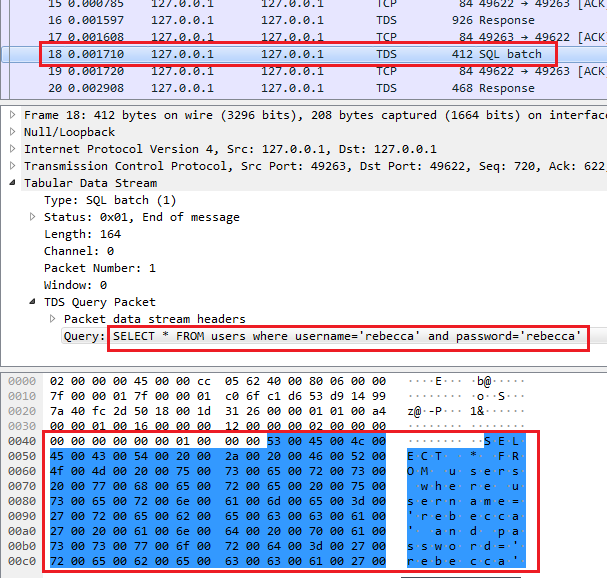
Going through the packets, select the one that says SQL batch and see the SQL query is created client-side and sent out. Any time you see client-side queries, you should be concerned.
 Client querying MSSQL server
The following query is executed (later we will come back and play with this):
SELECT * FROM users where username='rebecca' and password='rebecca
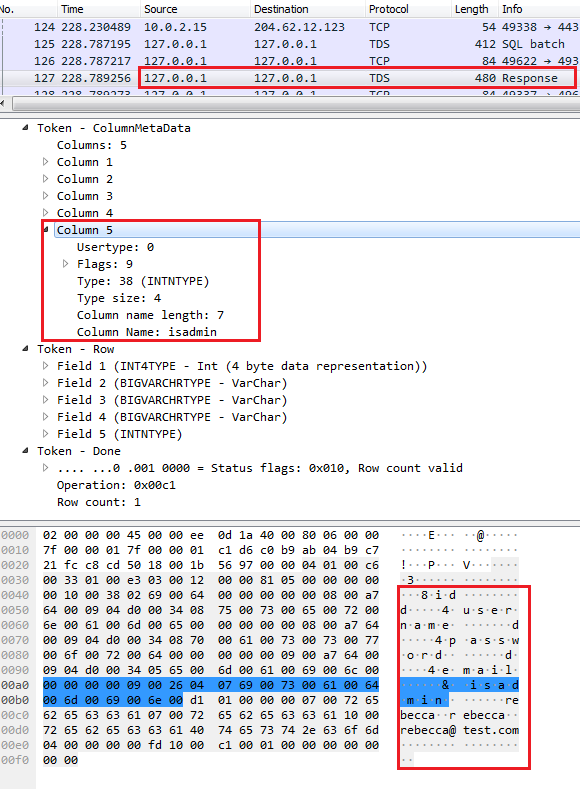
The response contains the query results which leaks the structure of the users table:
 Login query response
Admin Login
We know administrators can login to the application and backup data to an FTP server. We want to observe this traffic with Wireshark.
Logout and login with admin:admin123. Note admin interface has only one button, Backup Data to FTP Server. This should give us the clue that FTP credentials are hardcoded.
Looking at Wireshark, we will see two different streams of traffic:
- Connection to the MSSQL server.
- Connection to the FTP server.
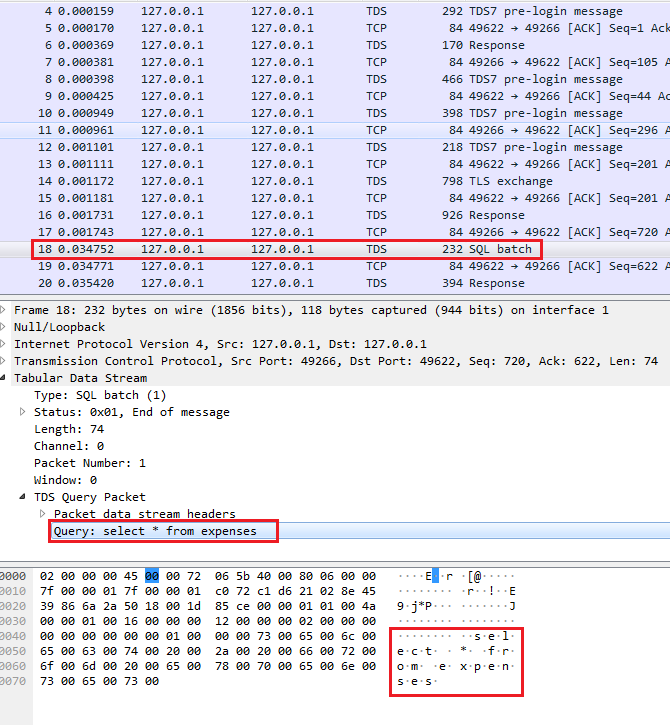
The connection to the MSSQL server is similar to what we have seen before (port 49622).
 Backup traffic to MSSQL server
The application connects and runs the following query:
select * from expenses
Next is the FTP connection to localhost:21. We can see it's in cleartext and user/pass is visible.
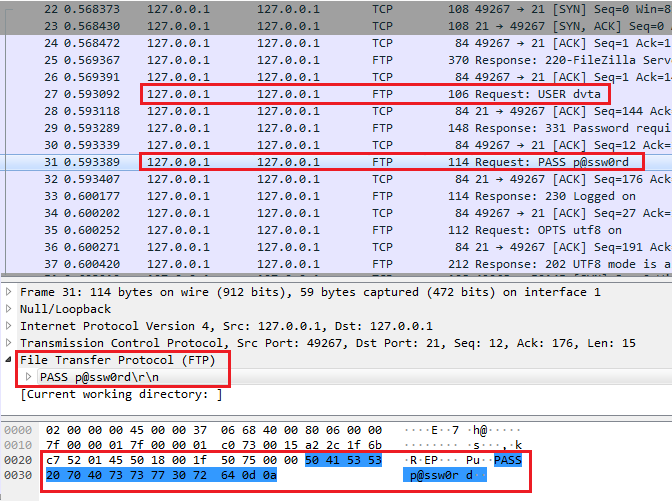 FTP traffic and password displayed in Wireshark
For easier visualization, right-click on any packet in the stream and select Follow > TCP Stream.
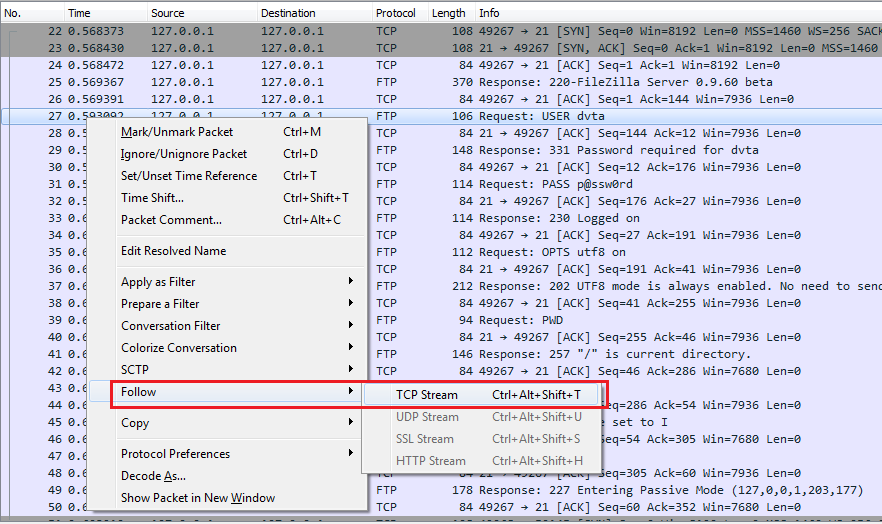 Following the TCP stream in Wireshark
Application logins with dvta:p@ssw0rd and then stores admin.csv on the FTP server (which we can assume contains information from the expenses table).
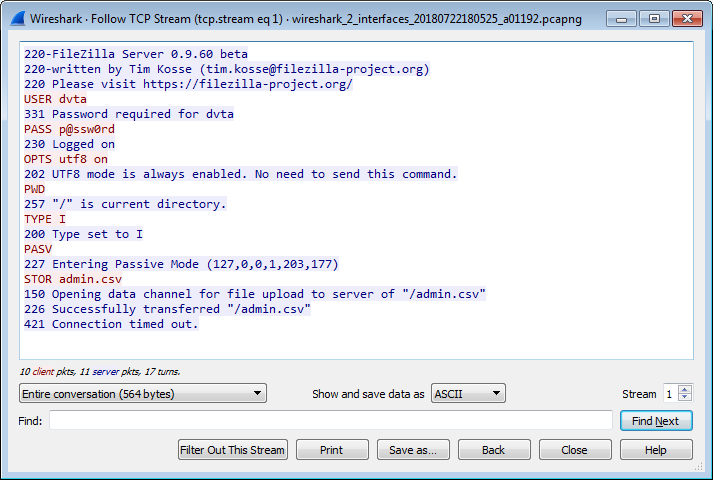 All FTP traffic in stream displayed in Wireshark
Register Functionality
We can also register new users. Users will not be administrators. Let's look at that traffic too.
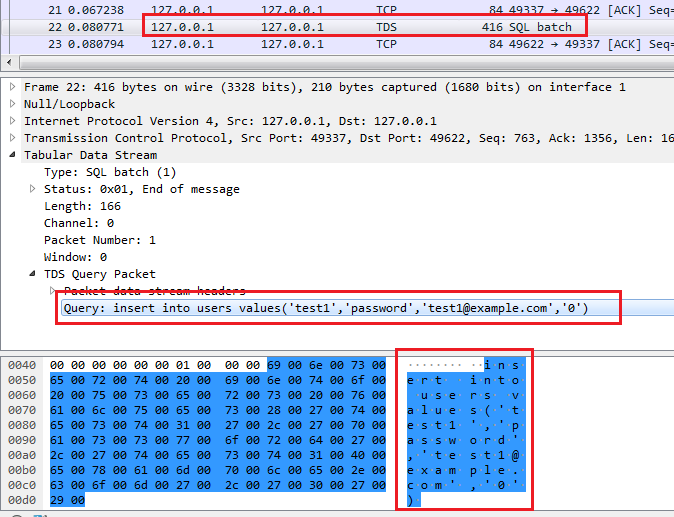 SQL statement to register a new user
As we can see, traffic is similar to the previous parts. This time we are sending an insert query:
insert into users values('test1','password','test1@example.com','0')
Note the 0 in the end. It's setting the isadmin column that we observed earlier.
Recon with Procmon
We can do the same with Sysinternals Procmon. We can see the traffic but we can identify the endpoints. For the record, Procmon does a lot more than what we are using it for.
Quit the application, run it again, login as admin and backup the data. Then run Procmon and set the following filters similar to what we did in part 1 to identify the FTP endpoint:
Process Name contains dvta. I have set this tocontainsbecause I have versioned patched executables from part 2.Operation is TCP Connect. Or you could only enable network activity like part 1 (DVTA - Part 1 - Setup - Discover the FTP Address).
 Application endpoints displayed in Procmon
We can see connections to:
- Fetching login token from
time.is:443. - MSSQL server at
localhost:49622. - FTP at
localhost:21and54823(ephemeral port for actualSTORaction).
Conclusion
We learned how to identify network endpoints using two tools. We did some limited traffic analysis. In the next part, we will learn how to manipulate traffic in different ways.